


Six takeaways for Philly policymakers from the Bicycle Coalition’s new report

Does it seem like there are more cyclists in Center City than there were ten years ago?
Mayor Michael Nutter’s administration embraced the goal early on of making Philadelphia the most bike-friendly city on the East Coast, and the Bicycle Coalition’s latest report finds some evidence that they’ve made real headway toward that goal.
Here are six lessons the report offers about which city policies have been successful at growing the ranks of bike commuters, and what the next Mayor and City Council could do to kick this these efforts into a higher gear.
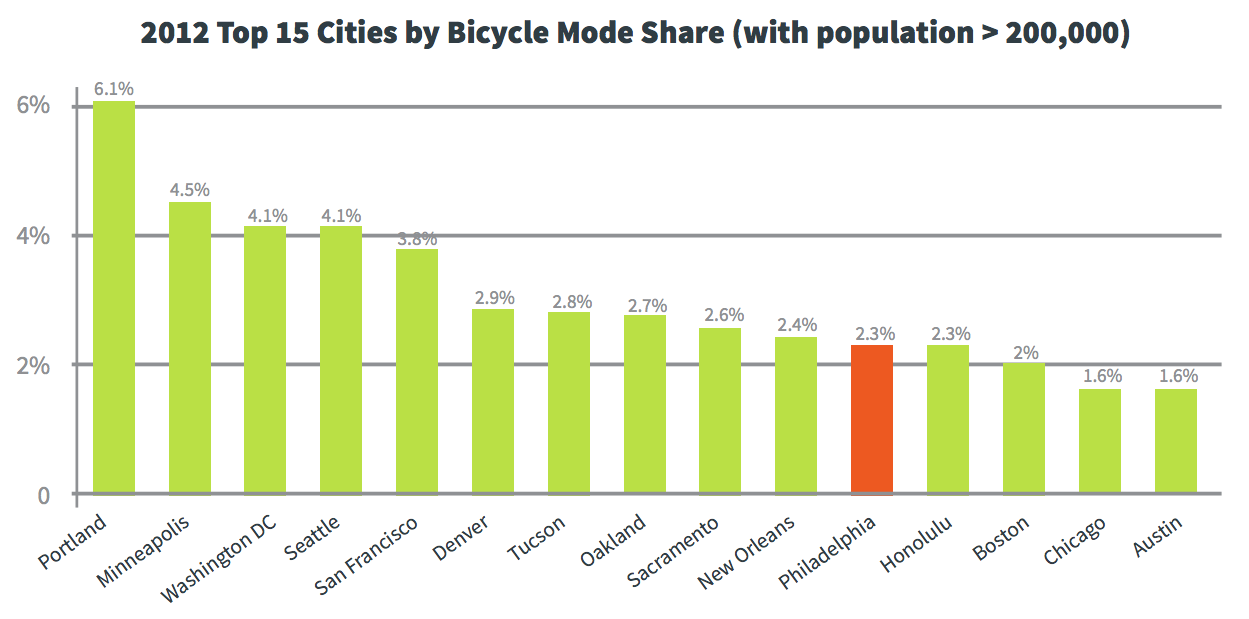
1) Philadelphia is the best big city in America for bicycling – embrace that.
2) If you build it, they will come.
One complaint that often arises when bike lanes are proposed is that the street in question doesn’t yet appear to have the bike traffic volume to justify a bike lane. But this gets the issue backward – the bike lanes come first, and the bike traffic follows. “If you build it, they will come” thinking has come in for a lot of scorn recently when applied to things like stadiums or casinos, or commercial properties built on speculation, but it does appear to be an effective way to encourage bike commuting. Every street fitted with a bike lane since BCGP started counting has seen an increase in bike traffic.
3) Women prefer protected bike lanes
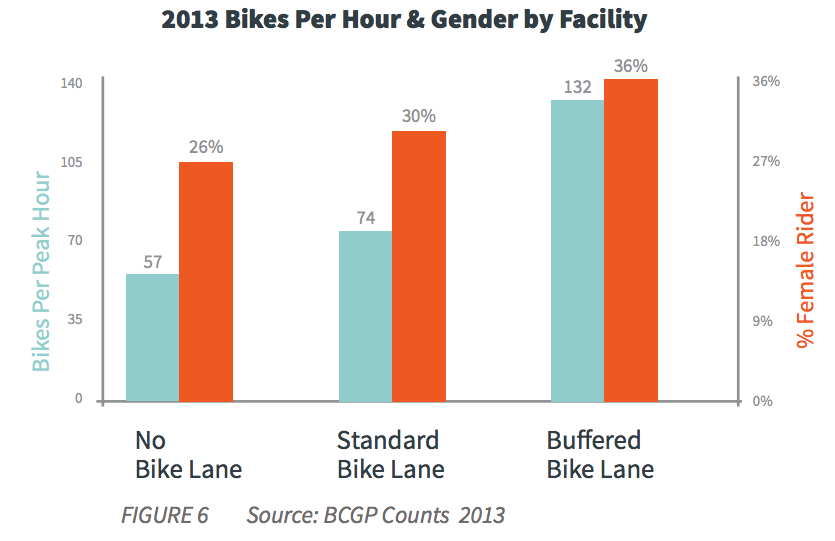
Buffered bike lanes – where a painted area thicker than a single stripe of paint separates bikes from cars – are Philadelphia’s current gold standard for bike lanes, and women appear to feel safer biking on streets outfitted with them, judging by the higher ridership rates in buffered lanes.
Women are more likely to be in the “interested but concerned” camp of cyclists, and cycle at lower rates than men, although a higher percentage of Philadelphia’s bike commuters are women (33%) than the national average (24%).
The most comprehensive study on protected bike lanes found that while regular bike lanes or no bike lanes may suffice for current cyclists, luring more of the “interested but concerned,” group onto the streets requires physically separating bikes from cars with planters or flexposts. Philadelphia has only one such protected bike lane, which is technically a trail, so growing the number of women cyclists (and newbie bike share riders!) is going to require more protected infrastructure.
4) Cyclists are better-behaved when they have dedicated right-of-way
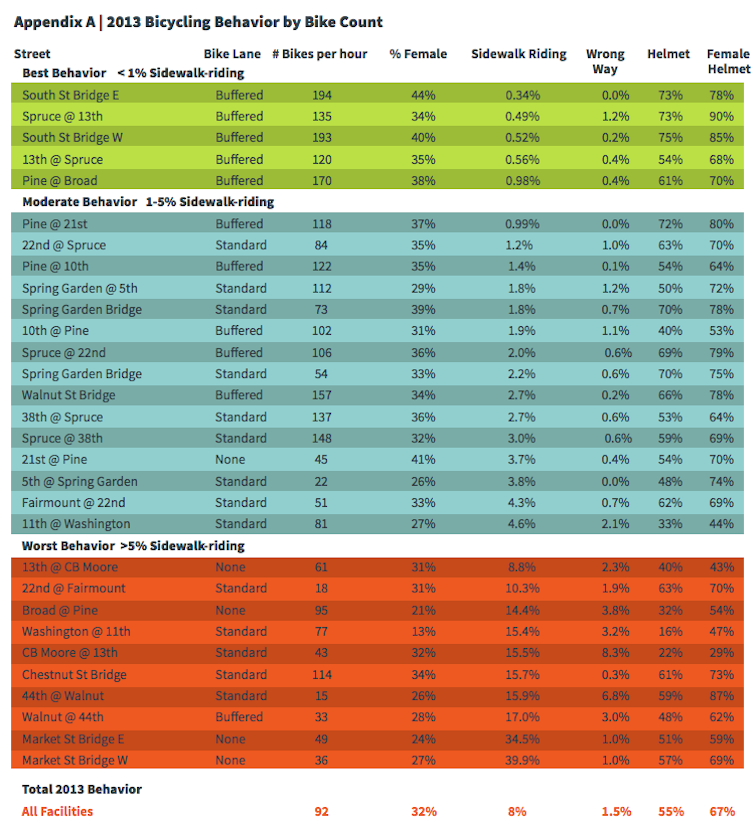
BCGP found that the more protected the bike lane is, the better cyclists behave. Sidewalk riding decreases significantly on streets with buffered bike lanes, as does helmet ridership. There are also fewer bike salmon.
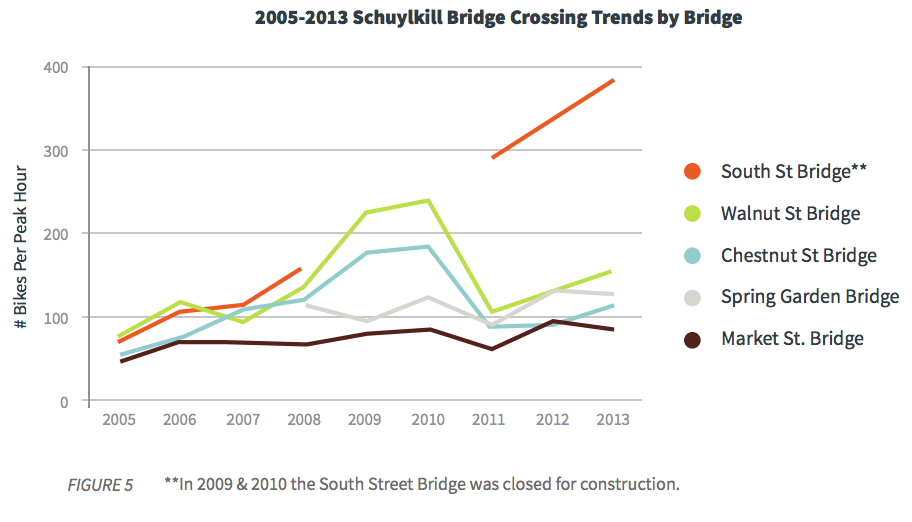
5) Bike infrastructure quality matters for ridership
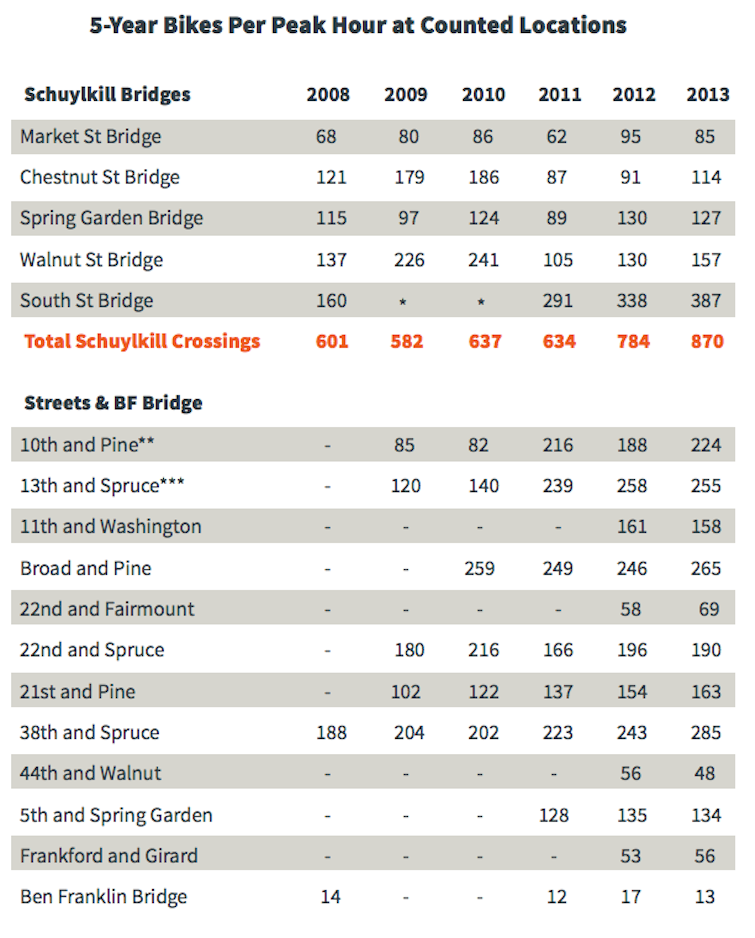
When the South Street bridge got a bike infrastructure upgrade, complete with bright green-painted lanes, its share of the cross-Schuylkill River traffic shot up to 46%, from 26% before construction. Market Street has the worst bike infrastructure of all the bridges, and its share of the bike traffic has remained low despite its superior connection to University City’s core job cluster. BCGP found that buffered bike lanes carry 80% more cyclists than regular bike lanes, and 133% more cyclists than no bike lanes.
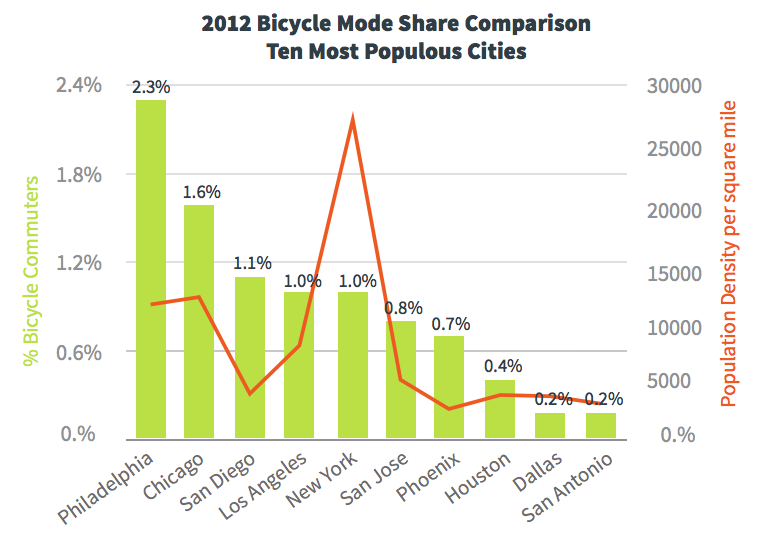
6. The higher the population density, the higher the bike ridership
Density is often seen as a dirty word in neighborhood politics, evoking Blade Runner or the crowded tenement conditions of the Great Depression, but a certain level of density does have some benefits.
A certain number of people (read: customers) per square mile are required for the economics of a good-sized neighborhood retail cluster or restaurant row to work out. And once an area has that density, the convenience of having access to lots of amenities nearby feeds back into residents’ transportation choices.
People in denser neighborhoods will make more short trips for their basic needs, and fewer long trips, increasing the utility of walking and biking over driving. It’s also just harder to accommodate cars for every household in denser places, leading some to trade off the hassles of car storage for some combination of walking, biking, public transit, and cabs.
BCGP sees a relationship between density, walkability and bikeability at the city level, and also at the neighborhood level, where Center City and South Philly – two of the city’s densest areas – have the highest bike ridership. Within individual Census tracts the numbers are sometimes much higher than the South Philly average of 5.5%. In my area of Bella Vista, bike commuter mode share is 20.5%!
WHYY is your source for fact-based, in-depth journalism and information. As a nonprofit organization, we rely on financial support from readers like you. Please give today.
Brought to you by PlanPhilly

PlanPhilly
In-depth, original reporting on housing, transportation, and development.

New analysis finds evidence of racial bias in Philly property assessments
The report found that property assessments in Black and Hispanic neighborhoods were more likely to be inaccurate.
1 day ago
Listen 1:24
Looking for a home in the Philly area this spring? Good luck
Prospective homebuyers still face an uphill battle finding a house in the Philly area. High prices and mortgage rates continue to be a burden.
2 days ago
Listen 9:34
5 ways to make your Philly-area home greener
Worried about your carbon footprint, but not sure where to start? Turns out there’s plenty you can do at home.
4 days ago