


Center City District: Surging Philly apartment market fueled by real demand, not a bubble

The latest report from the Center City District shows a booming residential market in Center City, particularly multi-family and mixed-use development, with no signs of slowing down.
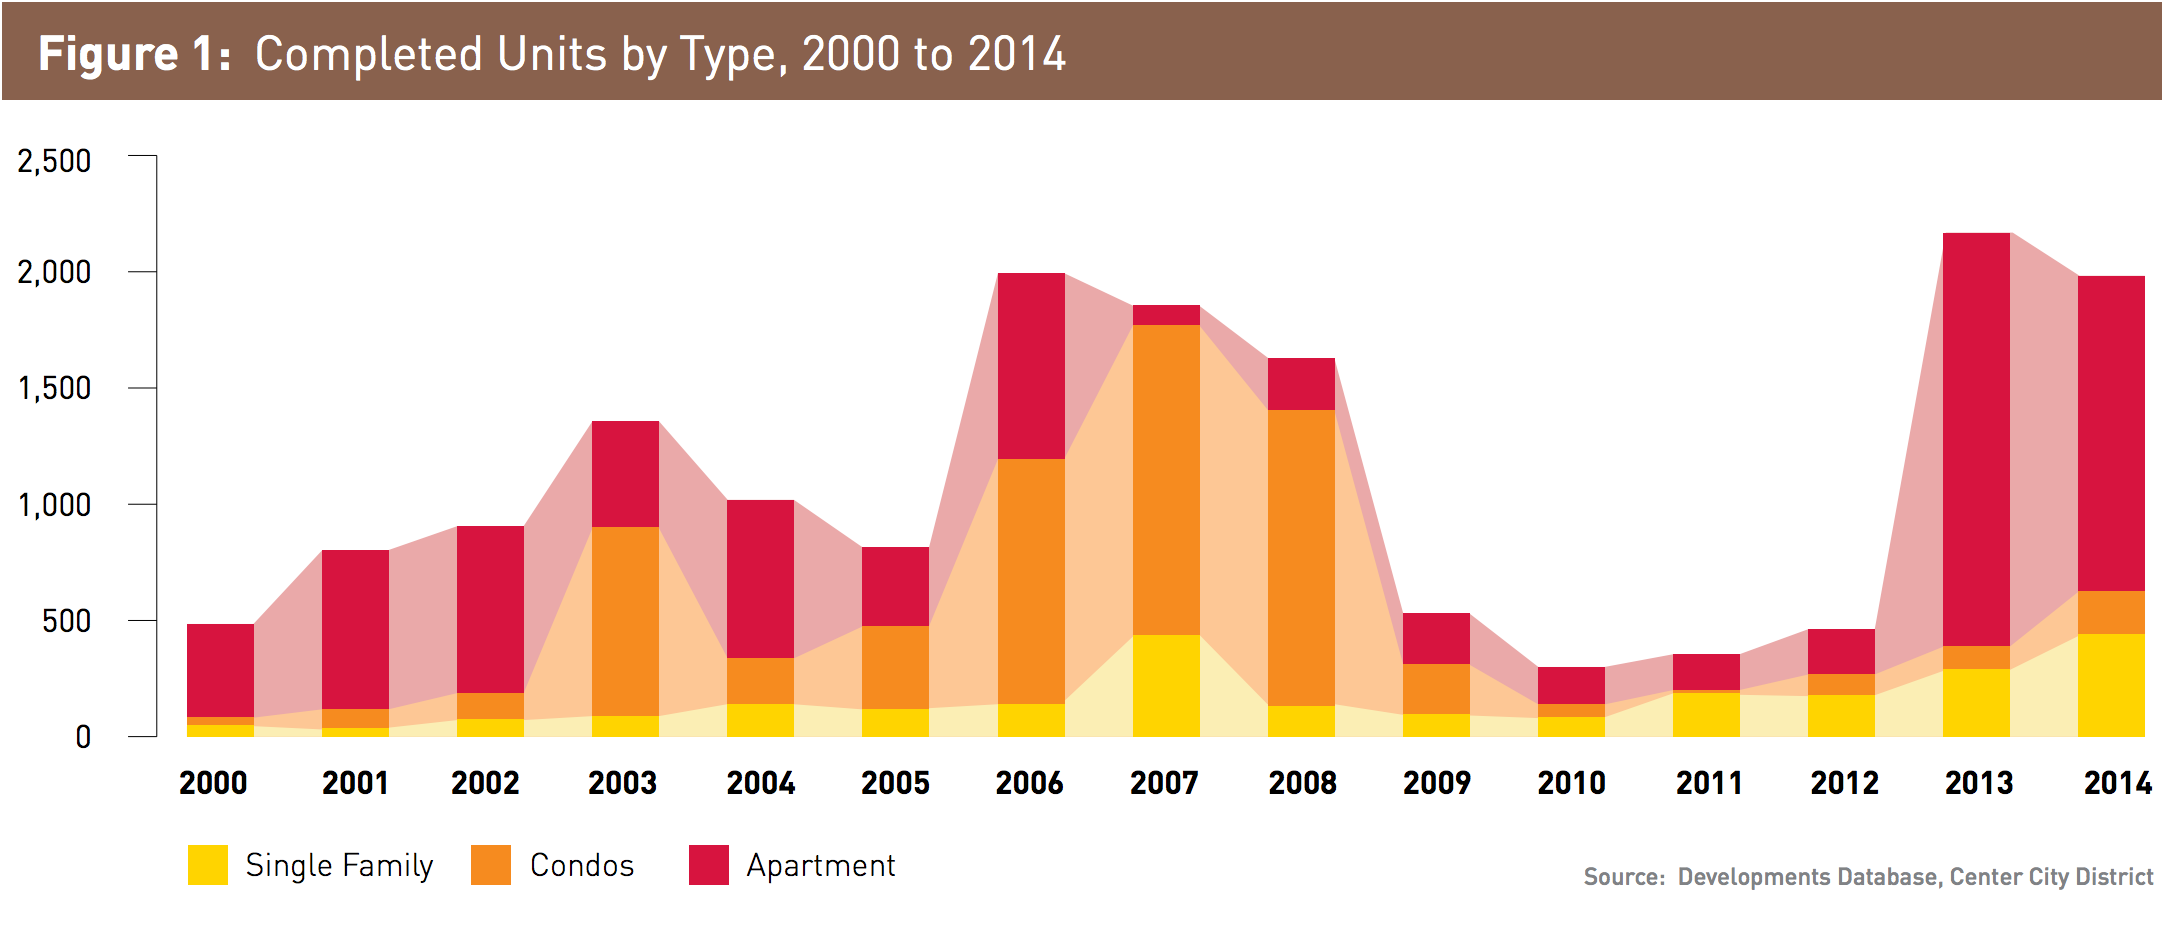
In 2014, the greater Center City area saw 1,983 new units come on line, of which 1,358 were apartments, 183 were condominiums, and 442 were single-family homes, according to CCD’s data.
While the Center City submarket has continued to shift toward multi-family housing, a consequence of falling homeownership overall, the share of for-sale units actually started bouncing back last year, from 18% in 2013 to 32% in 2014:
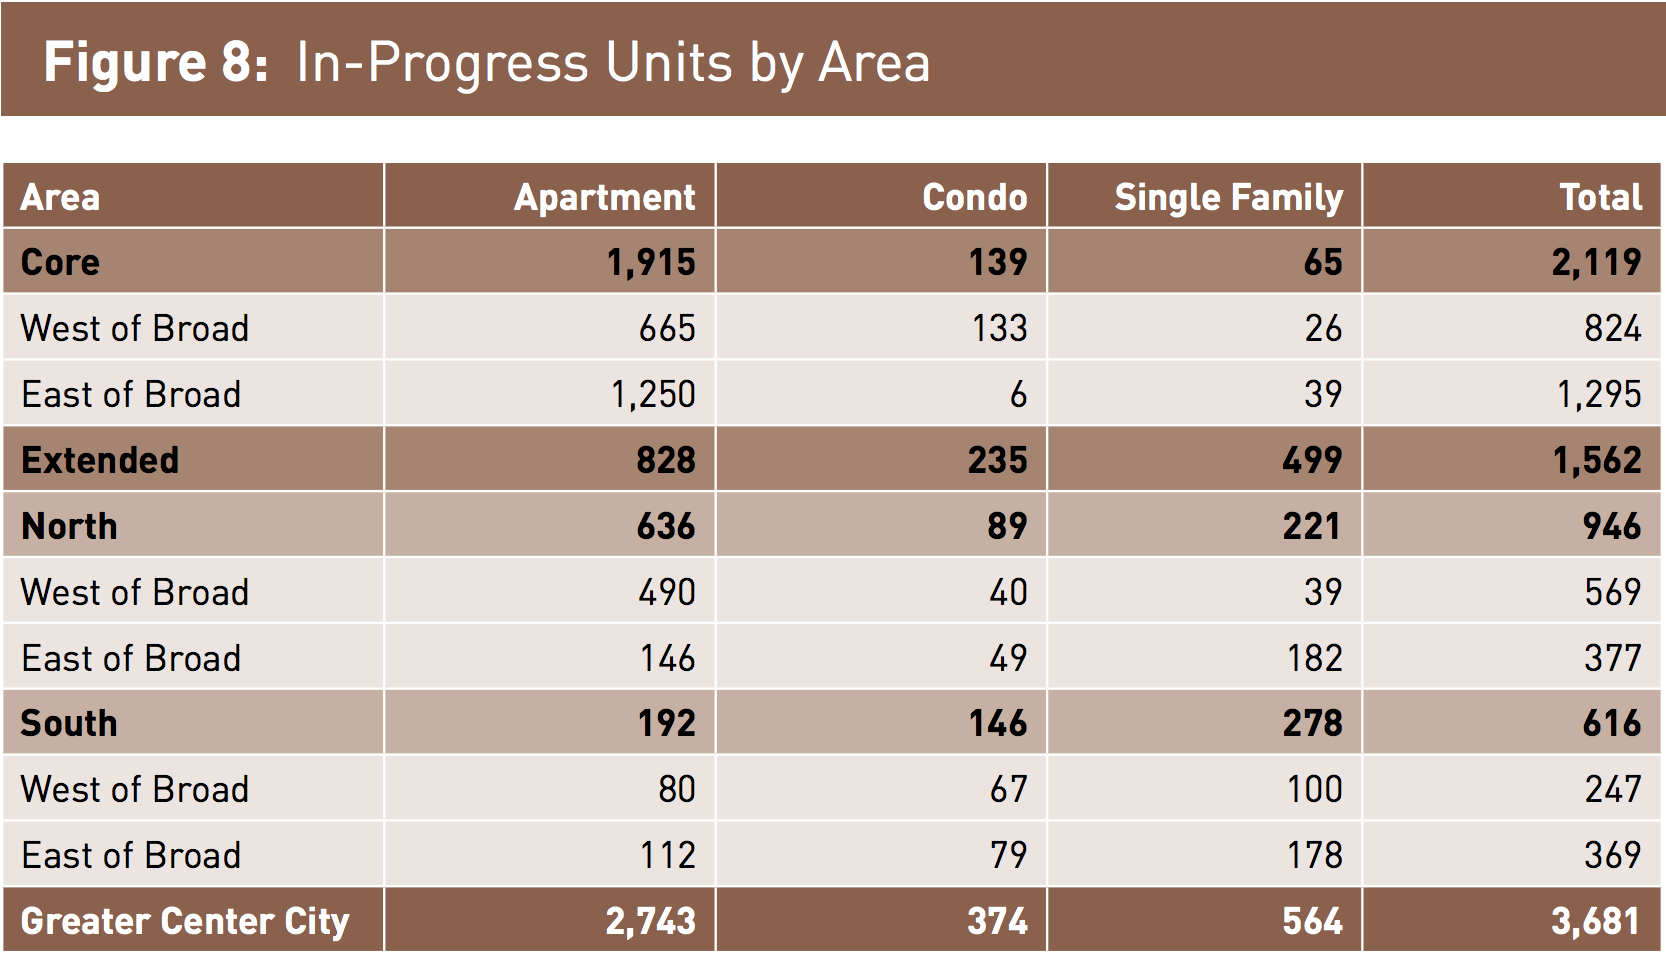
Center City District says there are 3,681 more units in the pipeline in this submarket over the next few years, and they point out that while most of the recent activity has been occurring west of Broad (72% of the units in 2014), the development frontier has now shifted east, boding well for Market East.
At a press availability this morning, CCD’s CEO Paul Levy said there has been “a dramatic shift, with 57% of what’s under construction now in the core. It’s almost a reversal of what we’ve had, which was two-thirds extended [Center City area], one-third in the core.”
“A much greater concentration of what’s happening right now is in the core neighborhoods,” he said, “so that’s reinforcing the residential density in the downtown.”
Levy is particularly excited about the opportunities he sees for some of these new mixed-use buildings to connect Market East to the successful commercial corridors in Midtown Village.
Seventy-five percent of the new units will be apartments, 15% will be single-family homes, and 10% will be condominiums. Some of those projects are still in the early stages, but 17 projects with 50 units or more are currently under construction, and “these larger projects, 86% of which are apartments, account for 2,446 (66%) of the 3,681 current, in-progress supply,” according to the report.
Is that too many apartments?
Not likely, says Levy. For the foreseeable future, supply should roughly match demand based on CCD’s demographic projections.
Using American Community Survey data, CCD calculated that between 2010 and 2013, there were 1,375 net new households added each year in this submarket – a 1.6% growth rate.
That trend held up in 2014 , bringing the total to 5,622 net new households between 2010 and 2014. The city added 5,269 new housing units during that period. Projecting the same growth rate of 1,375 new households per year from 2015-2018 (which Levy readily admits could be off), that suggests there will be 6,226 new households in Center City by 2018 who will need new housing.
“If they all arrived next June, there would be oversupply,” Levy says, “If they spread out over two to three years, looking at that rate of new households per year, then supply can be met by demand … Among everything that’s been announced, we think there’s comfortable support for 2,500 more units over and above the 3,681 that are in the pipeline.”
Levy cautioned that if we start seeing more project announcements that bring the total significantly above that, or if the timing of completions gets ahead of schedule, we could see an oversupply issue, but given the extremely tight apartment vacancy rate, the more pressing risk seems to be that we’ll build too little, not too much.
Even with all the new construction, the market remains tight, as evidenced by moderate increases in average home prices (6%), a 14% decline in the number of days homes spent on the market, and increases in rental rates in almost all the greater Center City neighborhoods.
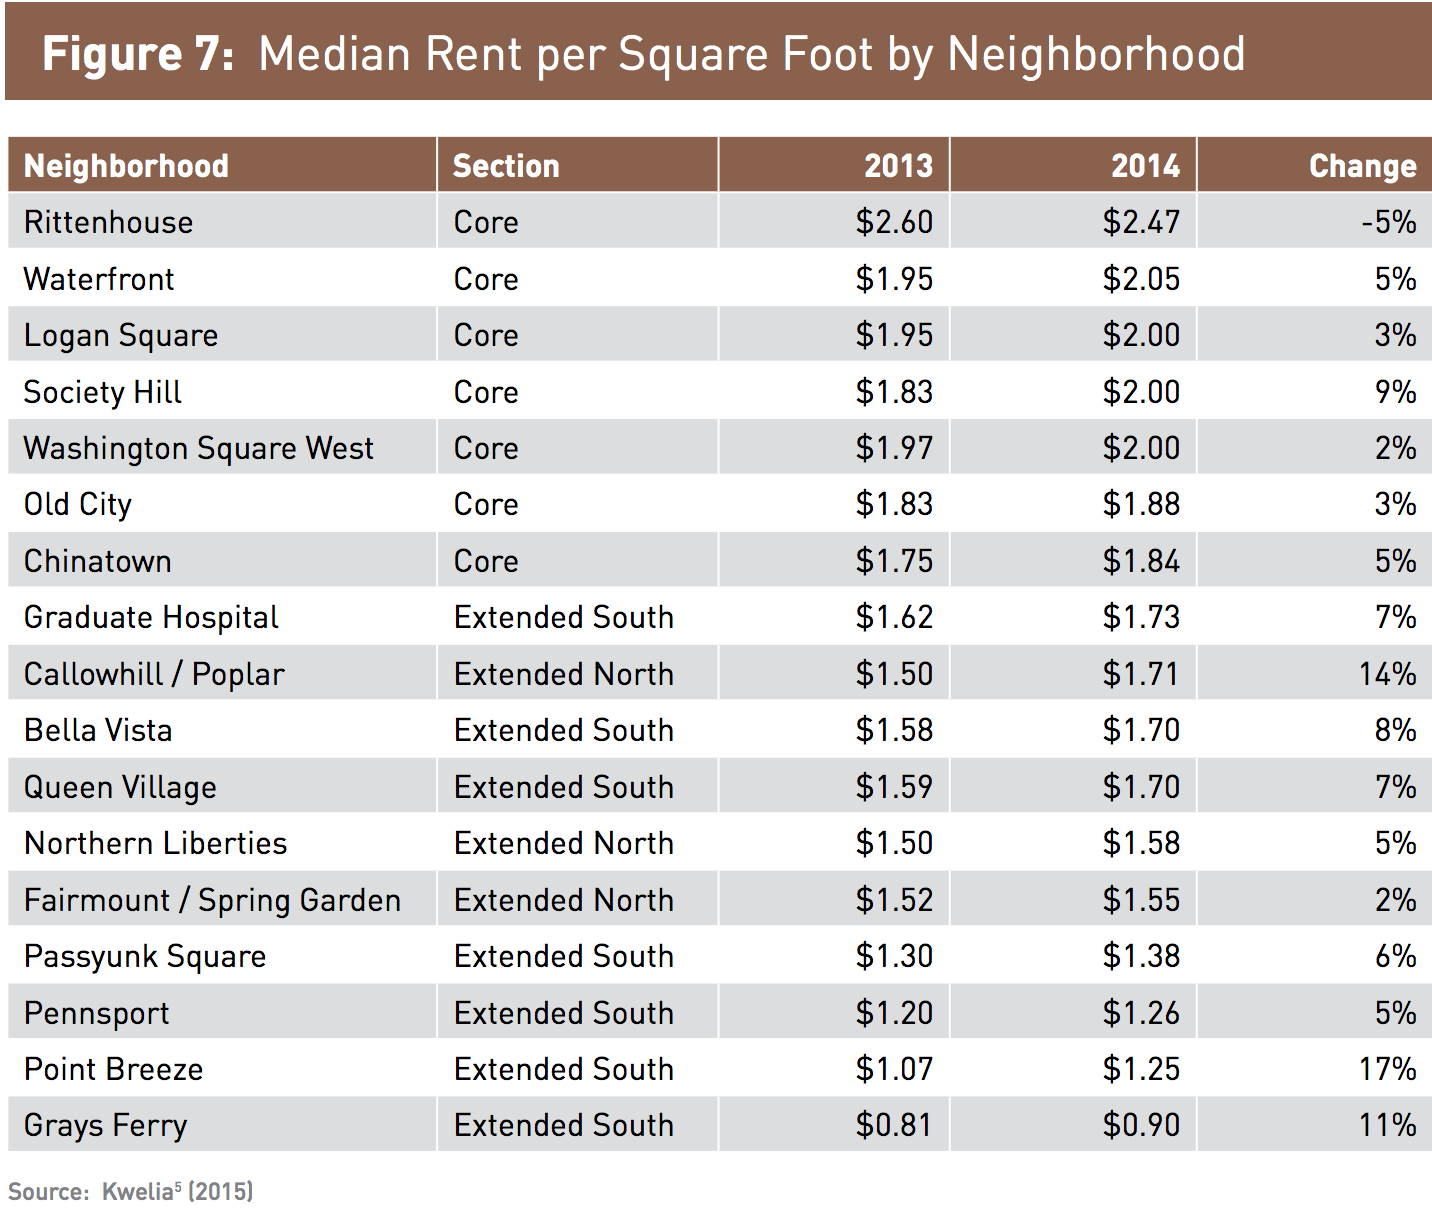
That doesn’t mean rents are pulling ahead of the median Philadelphian’s price range though. Overall the extended area remains about 39% cheaper than the core. And the areas with the biggest price jumps are starting from a very low price level. Rents went up 17% in Point Breeze (from $1.07 to $1.25), 14% in Callowhill/Poplar (from $1.50 to $1.71), and 11% in Grays Ferry (from $0.81 to $0.90). Here’s a chart showing which neighborhoods saw their rents increase the least and the most:
What’s the takeaway for policy?
Levy sees evidence that the appeal of Center City has to do with its proximity to jobs, businesses, and cultural amenities, its convenient transportation choices, and the option to forego car ownership.
The report includes this helpful chart of the neighborhoods with the lowest and highest car ownership in their study area:
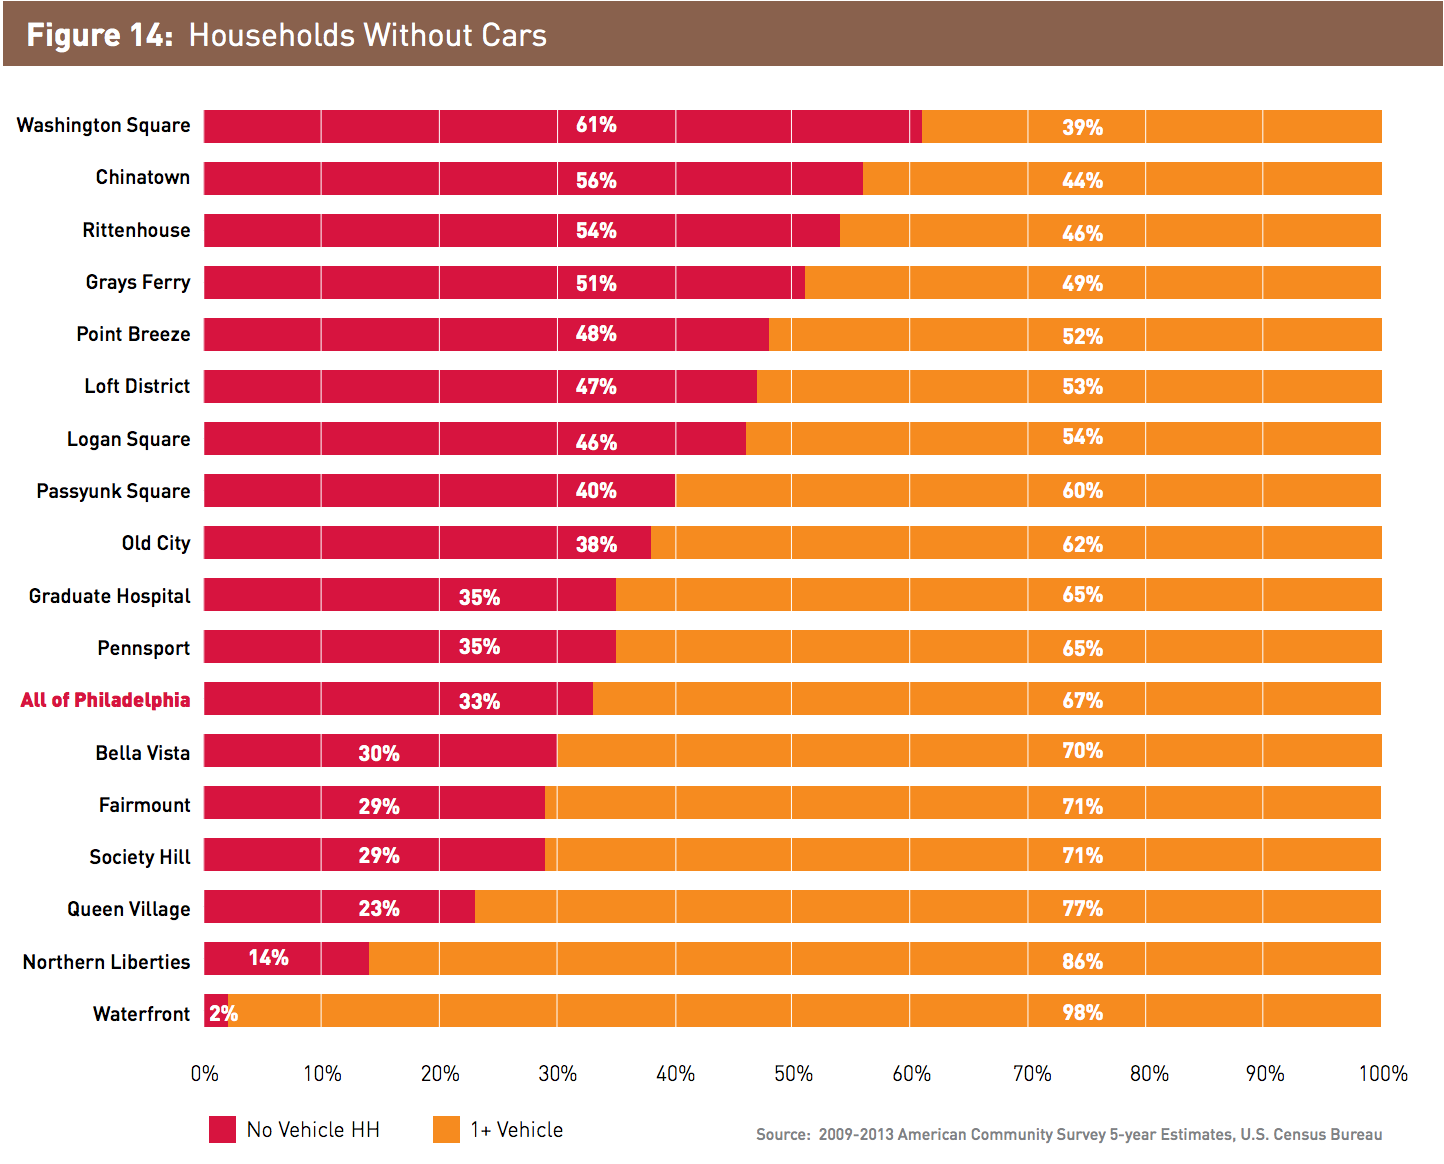
So on that front, the prescription is more of the same: more proximity, more mixed uses, more low-car development.
Levy also warned that issues like the school funding crisis and the city’s outsized reliance on wage and business taxes put the urban core at a competitive disadvantage with the suburban collar counties, and that improvements or setbacks on either front could change the growth projections.
Making the case for tax reform, Levy pointed out that traditional office employment has still been contracting and has not yet rebounded from the recession. There were 7,500 office jobs lost on net in Philadelphia between the second quarter of 2007 and the second quarter of 2014.
Read the full report here.
WHYY is your source for fact-based, in-depth journalism and information. As a nonprofit organization, we rely on financial support from readers like you. Please give today.
Brought to you by PlanPhilly

PlanPhilly
In-depth, original reporting on housing, transportation, and development.

The state Department of Transportation has spent billions of dollars as part of a robust bridge safety program, rehabbing and maintaining bridges.
2 days ago

New Castle County residents fight back against proposed data center
An investor owned firm says its proposed Delaware City data center will bring jobs. Residents say it will use too much energy and water.
3 days ago
Listen 1:14
‘Great concern’: Jersey Shore leaders call for restoration of beach replenishment funding
After the federal government cut funds for beach replenishment, Jersey Shore leaders are clamoring to bring it back.
3 days ago