


Recent studies: Americans are definitely, maybe (not) driving less

The latest report out of the University of Michigan’s Transportation Research Institute shows that the U.S. hit peak car, or the apotheosis of American automobile dependency, a decade ago.
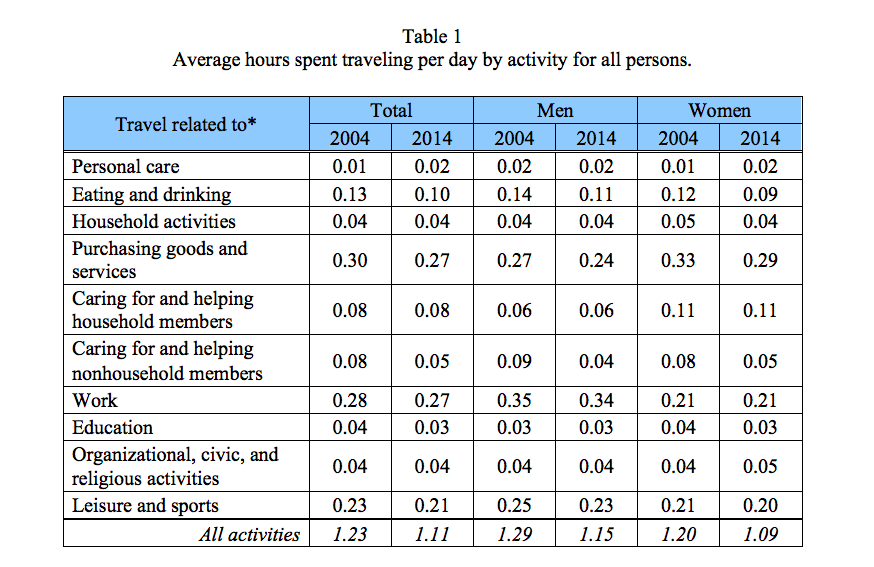
This report, the eighth in an ongoing series by Professor Michael Sivak called Has Motorization in the U.S. Peaked?, shows that Americans’ average hours traveled are down ten percent over ten years, along with the average percentage of people travelling per day, and that these downward trends began in 2004, meaning they can’t be attributed entirely to the Great Recession’s downward influence on trip-making.
These numbers echo Sivak’s seventh report, which showed that miles driven per person, miles driven per licensed driver, miles driven per household and miles driven per registered vehicle all hit their peaks in 2004 and have either gone down or remained relatively even in years since.
-

(University of Michigan Transportation Research Institute) -

(University of Michigan Transportation Research Institute)
So, that’s it, right? Can we finally say, yes, Americans have definitively turned their backs on hatchbacks, et. al?
Not quite. The answers you get on American driving habits depend entirely on the questions being asked. Subtle differences in how you approach these questions can produce completely different answers.
This eighth UMTRI study, released Monday, suggests that America’s love affair with cars is going the way of our love affairs with baseball, light beer, and manifest destiny. Which is to say towards a long, slow, far-from-inevitable break up.
While all these things are less popular today than they once were, they’re still big hits with Americans. An estimated 73.7 million fans packed Major League Baseball stadiums last year, seven of the top ten selling beers in the U.S. have the word “Light” in them, and President William McKinley, who annexed Hawaii, is still making headlines.
And driving? The latest Federal Highway Administration traffic volume trends show that Vehicle Miles Traveled is higher than ever, with an estimated 3.09 trillion miles driven in the twelve-month period ending June, 2015. VMT declined since the Great Recession began in 2008, but has been rising again since 2011.
So the earlier Michigan study says we’re driving less, but FHWA data seems to say we’re driving more. And this latest Michigan study says we’re spending less time traveling, but just last week the Texas A&M Transportation Institute (TTI) released its own study, which said Americans were spending more time than ever stuck in traffic.
DON’T THESE CONFLICTING STATS DRIVE YOU CRAZY?
The most recent Michigan study from Professor Sivak shows that travel times are down overall, caused by Americans electing to take fewer trips, rather than taking shorter trips. The data comes from the Bureau of Labor Statistics’ American time use survey, which measures travel times, not necessarily driving. But, as Sivak notes, private vehicles are used for the vast majority of all trips – 83 percent, according to the National Household Travel Survey in 2011. Thus, it’s a useful metric in trying to figure out if we’re spending less time behind the wheel.
-

(University of Michigan Transportation Research Institute) -

(University of Michigan Transportation Research Institute)
Let’s compare that to the TTI report. First, the TTI isn’t very popular among transportation analysts, who argue that it essentially asks the wrong questions by focusing on traffic congestion for vehicles rather than accessibility for people. David Levinson and Emilia Istrate at Brookings explained the accessibility v. congestion distinction by contrasting Manhattan, Kansas to Manhattan, New York: “Manhattan, NY, is more than 20 times as accessible as Manhattan, KS, despite speeds that are, at best, half as fast.” You can get to more things – jobs, shops, schools, you name it – in a big city in an hour’s time than you could get to in sprawling suburbia, regardless of gridlock.
The TTI study has also changed its methodology repeatedly, making year-to-year comparisons impossible.
Still, it’s not impossible to reconcile the University of Michigan and Texas A&M – this isn’t college football we’re talking about, after all.
The Michigan travel report reads in pertinent part: “The main implications of the present results are that the total travel time per person decreased substantially from 2004 to 2014, and that this decrease is due to a decrease in the proportion of persons engaged in the trips, and not an overall reduction of the duration of the trips.” [Emphasis added]
So, in other words, people who are still driving are spending as much time behind the wheel as before. But lots of us have stopped driving. And because this trend started in 2004, it’s unlikely that the economic slowdown in 2008 is to blame (or credit, depending on how you view these things) for the slowdown.
That also means that, despite the TTI’s numerous methodological issues, it could be true that those of us who are driving are spending the same, or maybe even more, time stuck in traffic. But it seems like more people are deciding to keep the car in the garage, opting to walk to work, bike to school or shop off Amazon.
That being said, it bears repeating that the TTI study is considered a pile of hot stinking garbage. “If you look at the [TTI report’s] top line,” says the Delaware Valley Regional Planning Commission’s Deputy Director of Transportation Planning, Chris Puchalsky, “You go: ‘I don’t know how they got that from the data.’”
“And I don’t know how they even got that data,” Puchalsky said, noting that he found the Michigan studies more useful.
Puchalsky prefers data sets released by the FHWA’s Highway Performance Monitoring System, which takes nearly three years to release its data. The lag is worth it, though, for better figures, says Puchalsky.
As for the seeming divergence between overall driving statistics provided by the FHWA and Michigan’s figures, which are based in part on those same FHWA statistics, that one is a bit easier: while miles per capita (and miles per drivers, and per capita) are down, we have more people, drivers and households than ever.
It’s not unlike the hysteria over whether millennials are either giving up on cars or buying tons of them. It turns out there are a ton of them, so it’s possible to have a lower percentage of millennials buying cars compared to previous generations and yet have more millennials purchasing cars now than Gen-Xers and Boomers did when they were in their 20’s and 30’s.
CHASING THE LATEST STATS: JUST A BRIDGE TO NOWHERE?
Trying to divine deep, meaningful trends in driving habits from the latest studies and reports is a little bit like trying to assess the economy’s health based on the daily fluctuations of the Dow Jones industrial. Which is to say, it’s stupid.
Like sensible economists, good transportation planners look for broad, established patterns, not the latest data blips.
At best, poking around the latest report can be a fun intellectual exercise. At worst, it misleads readers, especially because parsing statistics ain’t easy. (Full disclosure: I suck at statistics – it was my worst grade in college – so I’m basically the pot calling the kettle black here.)
And, says Puchalsky, many of these reports only present one piece of the transportation puzzle: driving. While it’s the biggest piece, that’s still an incomplete picture without also looking at transit, bicycles and walking. To that end, the DVRPC has been working to develop better pedestrian and bicycle counts.
The technology for them is a bit harder than the tried-and-true pneumatic tubes used for automobile counts, or the combo of head counts, ticket sales and passes for transit ridership estimates. But the DVRPC is “ahead of the curve” on using new pedestrian and bike counting technology, says Puchalsky.
For now, this is all academic. But accurate numbers for all modes of transportation can have huge ramifications down the line. For years, annual VMT was one of the factors in the federal transportation funding formula – in other words, states with higher VMT would get more federal money.
Even though the FHWA has been tracking the numbers all the while, the driving statistics and other figures used in the federal funding formulas haven’t been updated since 2009.
That’s because the last federal funding bill, Moving Ahead for Progress in the 21st Century Act, pegged state funding allocations to fiscal year 2009’s data. And that’s because MAP-21 was supposed to be a two-year fix to Congress’ inability to pass a long-term funding bill, to replace the ten-times-extended Safe, Accountable, Flexible, Efficient Transportation Equity Act: A Legacy for Users of 2005.
(Fun facts! the extra “LU” on this torturous backronym was in honor of one of the bill’s major supporters, Rep. Don Young (R-AK): His wife’s name was Lu. It’s also the bill that gave us the infamous “Bridge to Nowhere”.)
We’re still operating under MAP-21 today, which itself has been extended a few times now. This is better than turning off the spigot of federal funds altogether, but not exactly ideal for planning major infrastructure construction projects, which can take years to plan and build. PennDOT’s overhaul of segments I-95 running through Philadelphia, for example, began in 2011; the final section won’t start construction until 2019.
Still, should Congress ever pass a new transportation infrastructure bill, it’s likely that these figures would be updated. Whether the new formulas would include other modes, well, that’s anyone’s guess.
But, even if Congress remains more gridlocked than the Schuylkill Expressway, getting these statistical questions right – and thus, getting the right answers – can have massive implications on how we plan our cities and transportation systems.
A half-century ago, Philadelphia’s planners expected trends to continue and planned for a city of three million people, most of whom would drive everywhere. They asked how to get suburban residents to their downtown jobs the fastest and built highways into the city.
That didn’t happen. The city shrank for nearly six decades. Today, almost as many commuters use those highways to get to jobs outside the city as they do to get to work inside the city.
WHYY is your source for fact-based, in-depth journalism and information. As a nonprofit organization, we rely on financial support from readers like you. Please give today.
Brought to you by PlanPhilly

PlanPhilly
In-depth, original reporting on housing, transportation, and development.

The former chair of the Delaware Valley Regional Planning Commission board abstained from a vote on the agency’s long-term plan citing climate change.
3 years ago